Reproductions, new component calculations, real-data comparisons and failed alternatives. These results do not establish a complete explanation of cosmic solitude.
V01 · The dependency chain
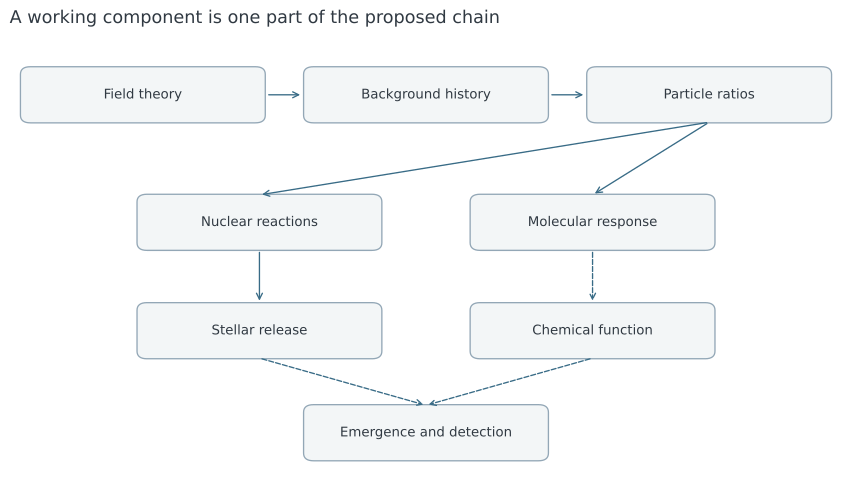
Conceptual schematic. Solid arrows identify calculated interfaces in declared models; dashed arrows require additional chemical-function, emergence or survey assumptions. No complete path has been established for our universe.Assumptions and provenance · Plotted data · PNG · SVG
V02 · The relevant energy is a difference
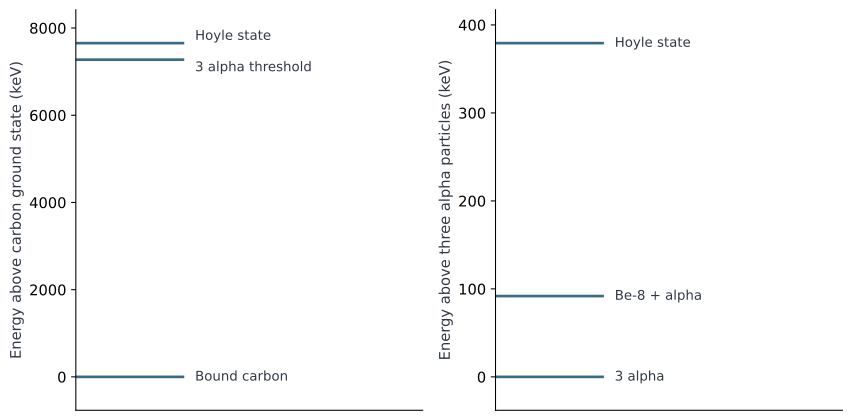
Evaluated baseline, with AME2020 neutral-atomic mass conventions stated explicitly. Excitation: 7654.07 ± 0.19 keV; excess above three alpha particles: 379.322 keV. Removing electron binding changes the convention by 0.793 keV; it does not justify renormalizing an empirical rate fit. Separate vertical scales; natural widths are not drawn.Assumptions and provenance · Plotted data · PNG · SVG
V03 · Correlated local resonance sensitivity
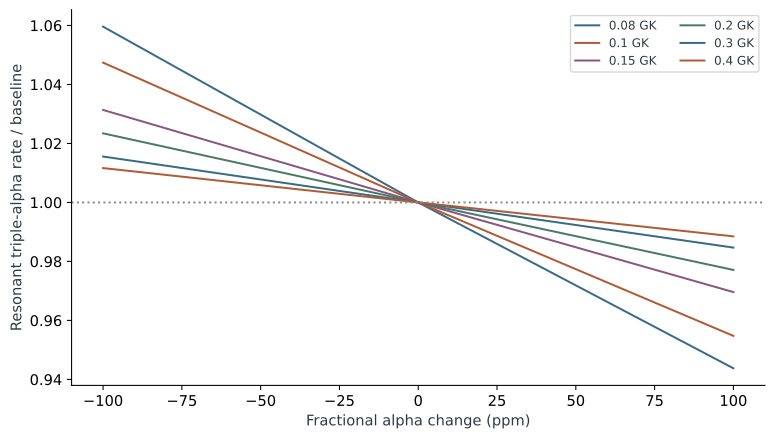
Local photon-response scenarios use the published 3.99 ± 0.09 MeV derivative of the relative Hoyle energy. Median response curves are shown at fixed temperature and radiative width. They are not stellar yields or a posterior over viable universes.Assumptions and provenance · Plotted data · PNG · SVG
V04 · A parcel measures composition and time
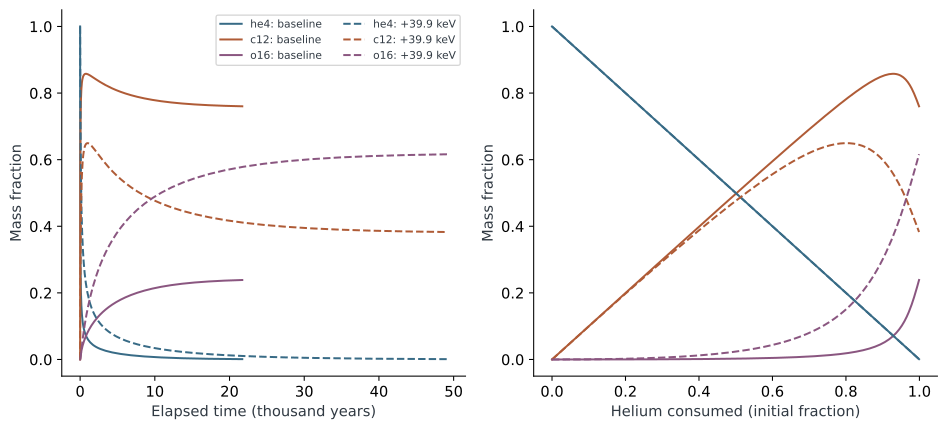
13-species alpha network with reverse rates and plasma screening, at 0.2 GK and 10,000 g/cm³. Solid: baseline; dashed: imposed +39.9 keV. Compare equal elapsed time with equal helium consumption. This parcel has no stellar thermostat, winds or evolving structure.Assumptions and provenance · Plotted data · PNG · SVG
V05 · Density changes the response
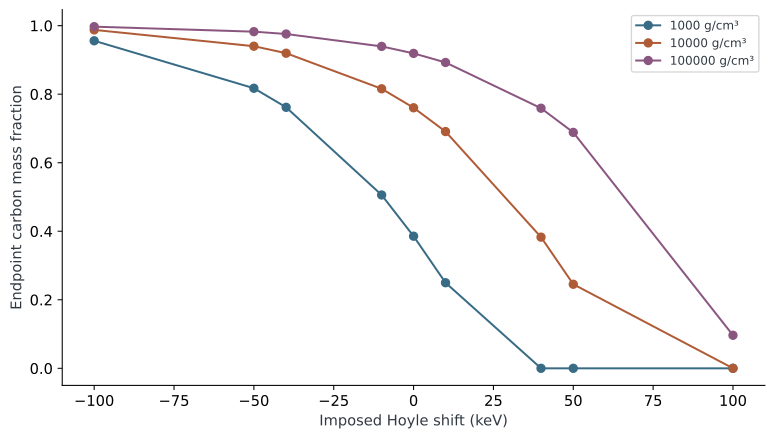
The unscreened 13-species network with reverse rates at 0.2 GK. Endpoint means helium depletion when reached, otherwise the declared three-billion-year calculation cap; the data retain that flag. Density is an ordinary nuisance parameter, not a phase probability.Assumptions and provenance · Plotted data · PNG · SVG
V06-E1 · Complete E1 capture amplitude
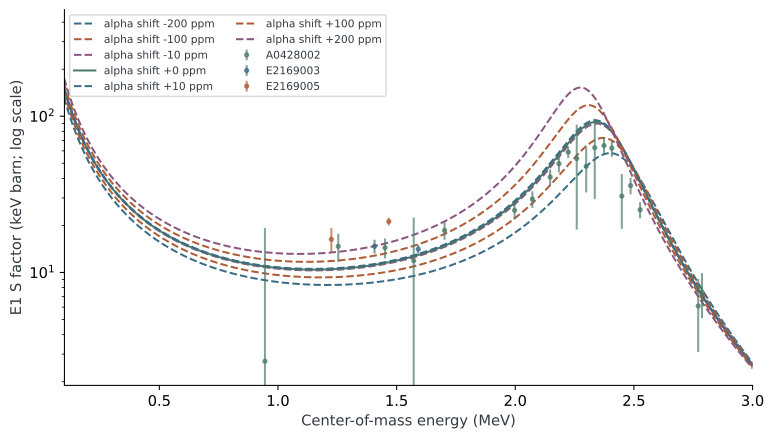
Reproduced coherent E1 ground-state capture amplitude, compared with frozen EXFOR multipole measurements. Dashed curves vary alpha while holding effective-range and subthreshold inputs fixed. This derivative scenario is not a fully matched nuclear theory. E2 excludes the missing 2.68-MeV resonance; cascades are absent. Reported point errors and normalization scenarios are distinct.Assumptions and provenance · Plotted data · PNG · SVG
V06-E2 · Complete E2 capture amplitude
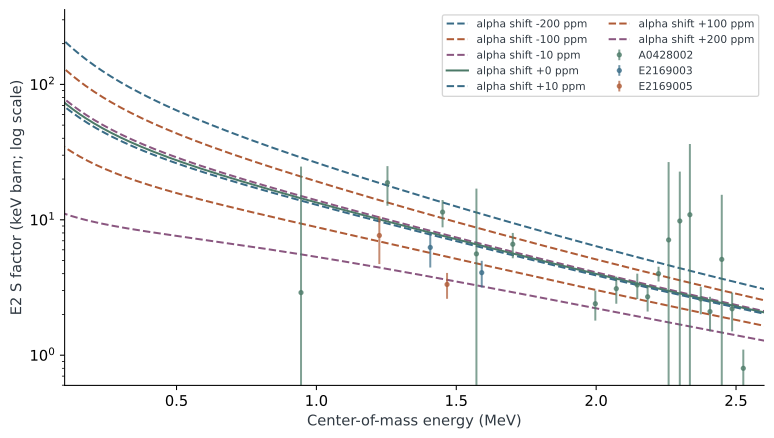
Reproduced coherent E2 ground-state capture amplitude, compared with frozen EXFOR multipole measurements. Dashed curves vary alpha while holding effective-range and subthreshold inputs fixed. This derivative scenario is not a fully matched nuclear theory. E2 excludes the missing 2.68-MeV resonance; cascades are absent. Reported point errors and normalization scenarios are distinct.Assumptions and provenance · Plotted data · PNG · SVG
V06-rate · Thermal capture response
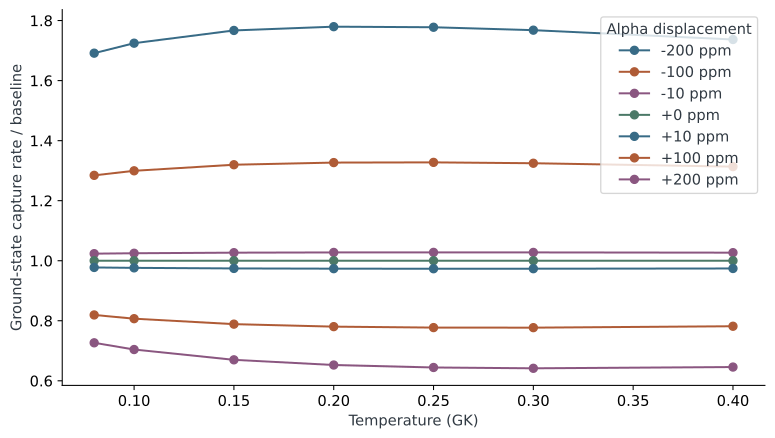
Thermal average of the complete E1+E2 ground-state calculation. At +200 ppm the rate is about 0.65 of baseline near 0.2 GK in the fixed-nuclear-input scenario. This is neither the total capture rate with cascades nor a measured change of alpha.Assumptions and provenance · Plotted data · PNG · SVG
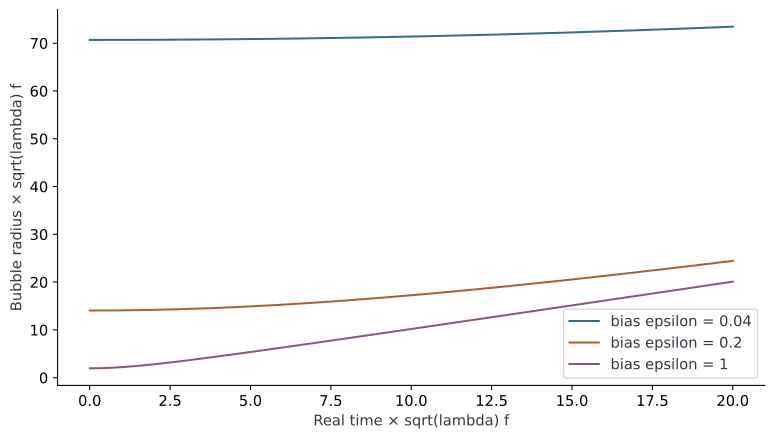
V08 · A boundary evolved in real time
Lorentzian spherical field evolution initialized from an O(4) bounce at zero time derivative. The subsequent radius is a dynamical result. Grid refinement resolves the contracted wall; the Euclidean coordinate is never relabeled as time. Flat space, no collisions.Assumptions and provenance · Plotted data · PNG · SVG
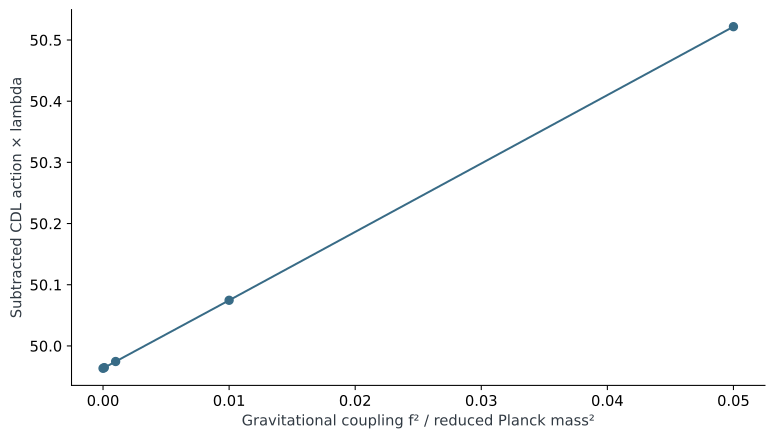
V09 · Gravity has to be tested in its regime
Independent Coleman–De Luccia boundary-value solutions with a Minkowski false vacuum and anti-de Sitter true vacuum. The action approaches the flat-space solution as f²/Mpl² approaches zero. For f=100 GeV the coupling is 1.69×10⁻³³, far below the plotted values. This local bounce test does not establish a benign cosmological interior.Assumptions and provenance · Plotted data · PNG · SVG
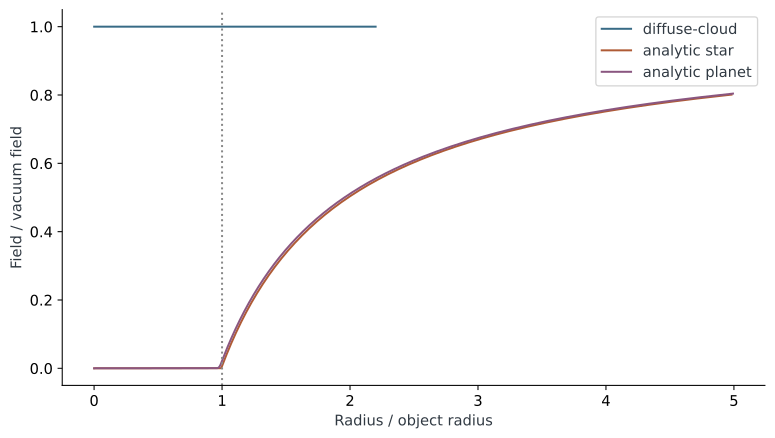
V10-analytic · The field inside matter
Nonlinear symmetron profiles including the photon-induced material source. These three density profiles are analytic controls. Dense Earth and stellar cores can both restore the same local alpha, despite a different vacuum value. The photon benchmark also predicts excessive force and is not an allowed model.Assumptions and provenance · Plotted data · PNG · SVG
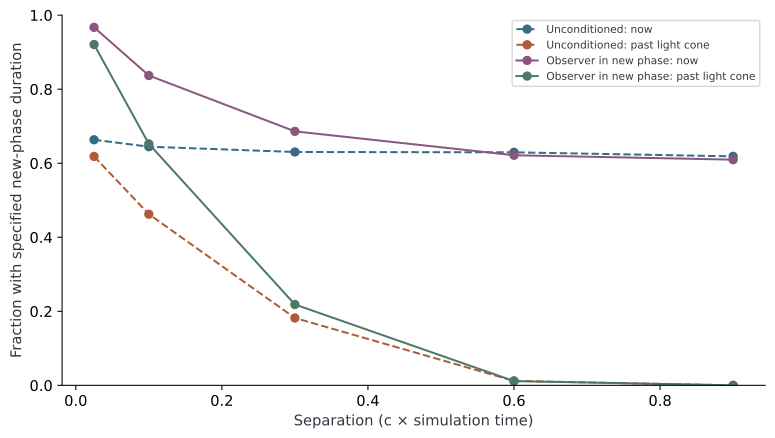
V11 · Conditioning changes the sample
Three-dimensional Poisson-front histories, sampled with and without conditioning on an observer in the new phase. The duration threshold is a sensitivity setting. Looking at earlier emission times changes the eligible targets again. These are phase histories, not probabilities of life.Assumptions and provenance · Plotted data · PNG · SVG
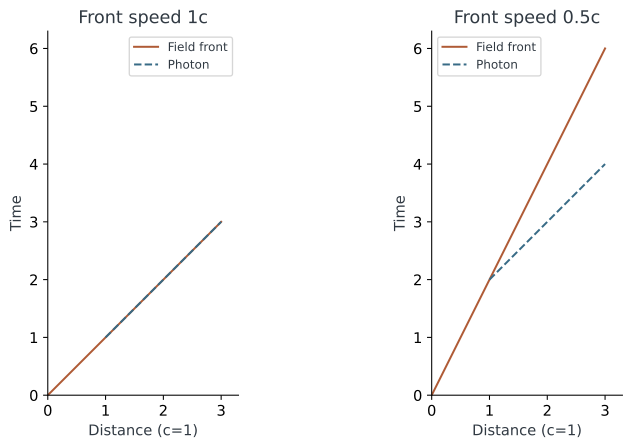
V12 · Which signal arrives first?
Analytic spacetime control with equal axis units. In the collinear light-speed case, light emitted when the front changes the source arrives with the direct front. A slower front can be preceded by that light. This is a causal restriction, not a universal ban on observing different backgrounds.Assumptions and provenance · Plotted data · PNG · SVG
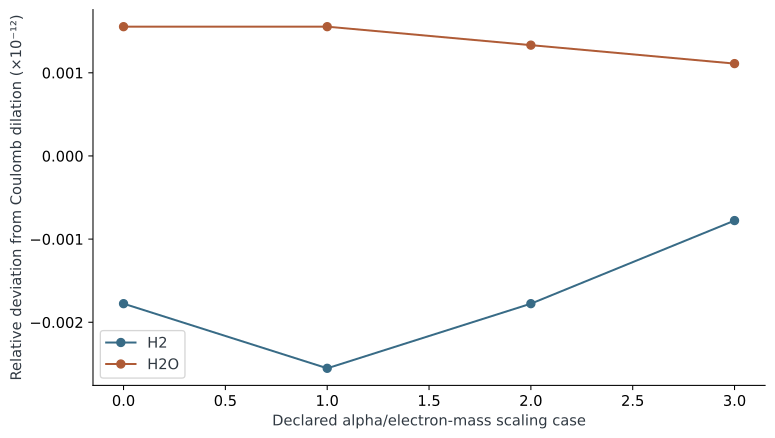
V13-scaling · Explicit molecular scaling control
Explicit H2 and water Hamiltonians reproduce nonrelativistic Coulomb dilation after lengths and energies are rescaled. Deviations here are numerical roundoff. Relativistic corrections, finite nuclear masses and a time-dependent passage are separate calculations; scaling alone is not evidence of chemical failure.Assumptions and provenance · Plotted data · PNG · SVG
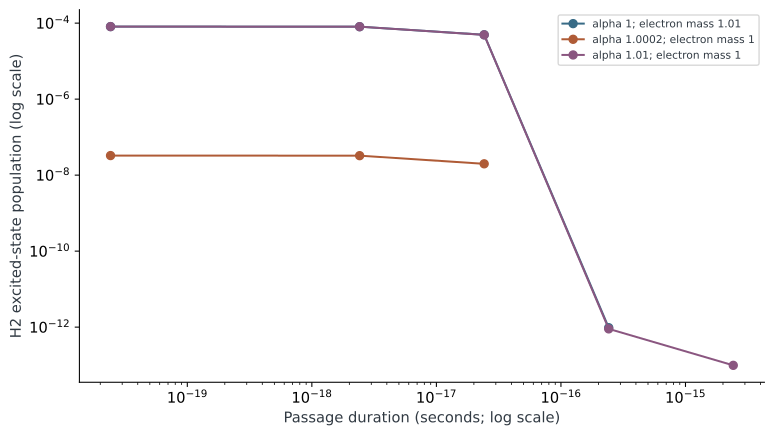
V13-passage · A rapid change does work on a molecule
Time-dependent two-electron H2 calculation at fixed nuclei, with normalization and background-work checks. Excitation depends on passage duration and displacement. Values below 10⁻¹⁴ are masked as unresolved. The response is not a biological threshold.Assumptions and provenance · Plotted data · PNG · SVG
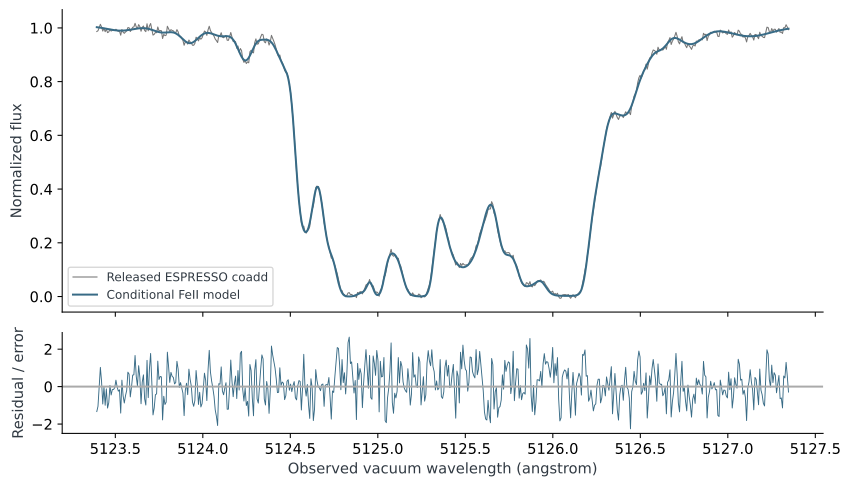
V14-real · A scoped real-spectrum comparison
Measured FeII 2382 window and a converged fit with published velocities and widths held fixed. Columns, alpha, continua and calibration offsets are fitted. Fully free 45-component fits did not converge, so this conditional result supplies neither a robust independent bound nor a detection.Assumptions and provenance · Plotted data · PNG · SVG
V14-recovery · A calibration error can imitate a signal
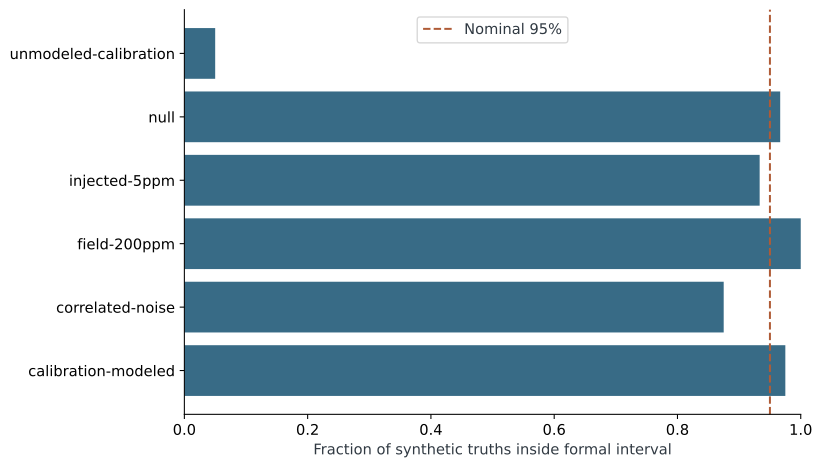
Synthetic injection recovery. Underestimated line-calibration errors produce severe undercoverage; modeling those errors restores much of it. Correlated-noise coverage is still imperfect. These generated trials are not observed field signals.Assumptions and provenance · Plotted data · PNG · SVG
V16-collider · Match the measured observable
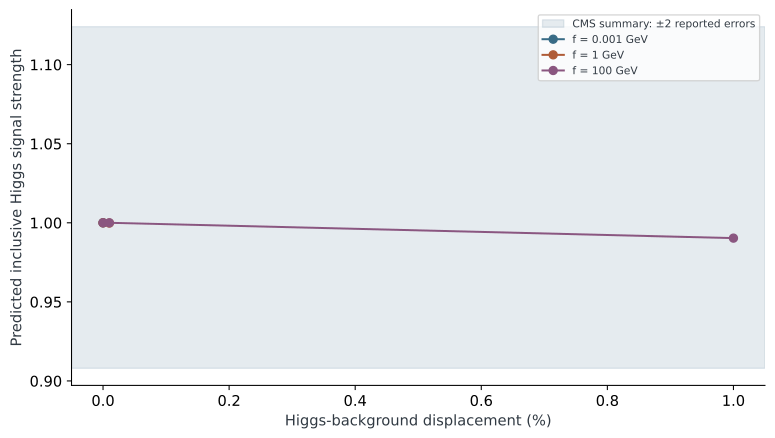
Scalar mixing and open scalar-pair decays are translated into an inclusive Higgs signal. Only perturbative points with a Higgs-like mass near 125 GeV are plotted against the CMS summary; invalid points remain in the data. This envelope does not replace a channel-by-channel collider likelihood.Assumptions and provenance · Plotted data · PNG · SVG
V16-BBN · Missing nuclear response matters
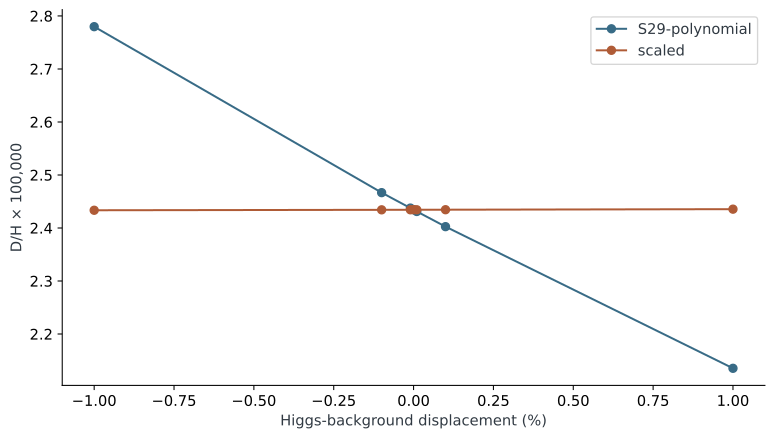
Actual primordial-network integrations with matched leading weak/background changes and two explicit deuteron-response closures. The strong forward-rate response is incomplete and weak response is Born order. The curves show theory sensitivity, not observational exclusions. Ordinary full-correction baselines are reported separately.Assumptions and provenance · Plotted data · PNG · SVG
V17-abundances · A ratio alone does not identify the cause
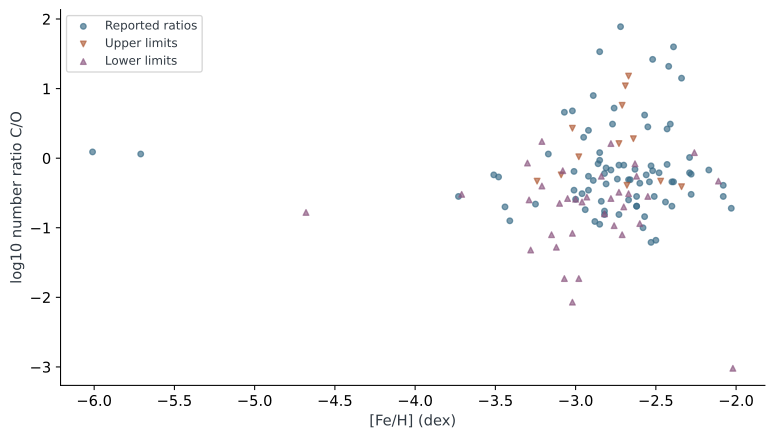
JINAbase dwarfs and subgiants selected by reported carbon and oxygen at [Fe/H] below −2. Limits and repeated analyses remain visible; the likelihood shares a latent abundance within each star and includes publication offsets. Measurement floors are explicit scenarios because the interface supplies no abundance covariance. A common C/O shift is degenerate with ordinary enrichment.Assumptions and provenance · Plotted data · PNG · SVG
V18 · Longevity depends on dimension and scale
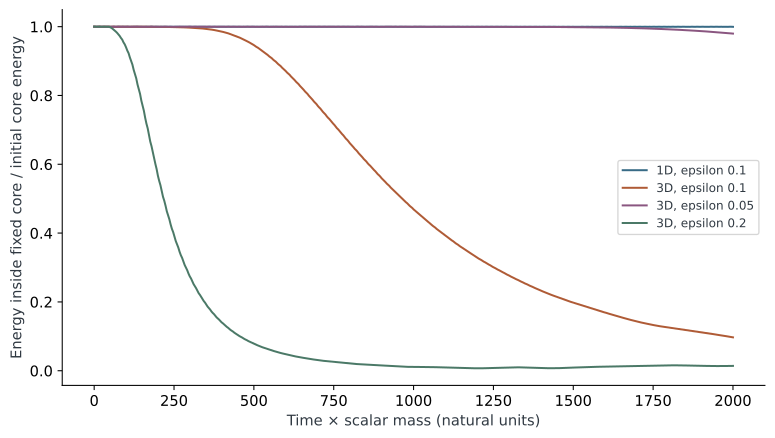
Canonical phi-six subset of the cited oscillon model. Three-dimensional core energy can radiate away even when a one-dimensional configuration persists. Grid, box and integrator controls are separate. Two thousand mass-times are about 5×10⁻²³ seconds for a 25-GeV scalar; assigning a smaller mass requires new constraints.Assumptions and provenance · Plotted data · PNG · SVG
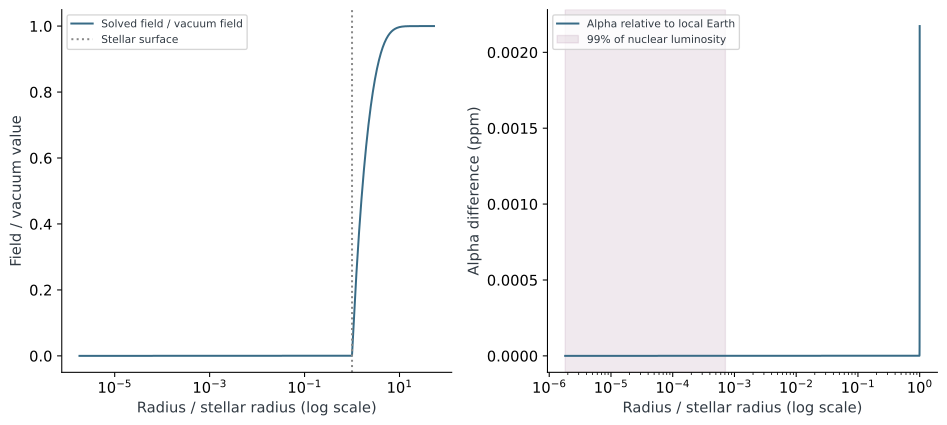
V10-stellar · Screening removes the core difference
Nonlinear field solution on an actual 15-solar-mass MESA helium-burning profile. The shaded region supplies 99% of the modeled nuclear luminosity. Its alpha agrees with dense Earth, although the ambient vacuum differs. Feeding that interior field into the reaction network gives the unmodified result. The same photon benchmark fails the fixed-planet force assumption; this is a diagnostic null, not an allowed screened theory.Assumptions and provenance · Plotted data · PNG · SVG
V07 · The stellar thermostat responds
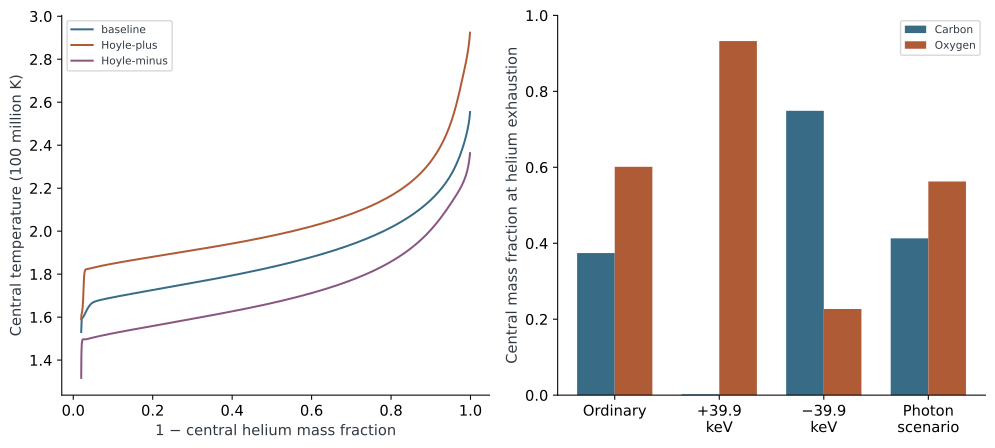
Actual 15-solar-mass MESA tracks at Z=0.02. The star adjusts its temperature after an imposed resonance shift, but substantial central carbon/oxygen differences remain. The photon scenario combines +200 ppm alpha, its +0.798 keV Hoyle response, and the fixed-input capture calculation with a 50% ground-state fraction. Ordinary EOS, opacities and weak rates remain in use. Central fractions are not ejected yields; mesh/time refinement and ordinary wind/mixing alternatives are in the report.Assumptions and provenance · Plotted data · PNG · SVG
V07-release · Core production and released material differ
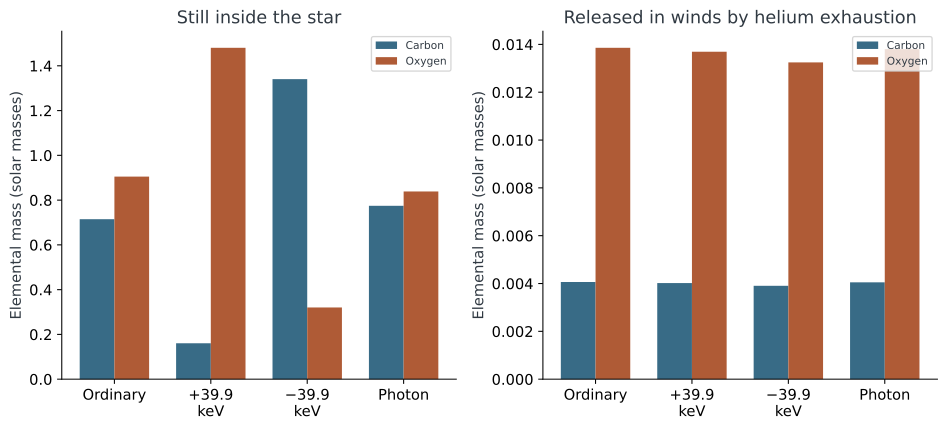
Total retained and wind-released carbon/oxygen at core-helium exhaustion, with separate vertical scales. Winds largely sample the envelope at this stage; the strongly changed core inventory is not automatically available to later generations. A terminal explosion/remnant model is absent, so no supernova ejecta are shown. Net yields as well as total yields are saved in the table.Assumptions and provenance · Plotted data · PNG · SVG
V15 · A temporary rate history leaves a wind record
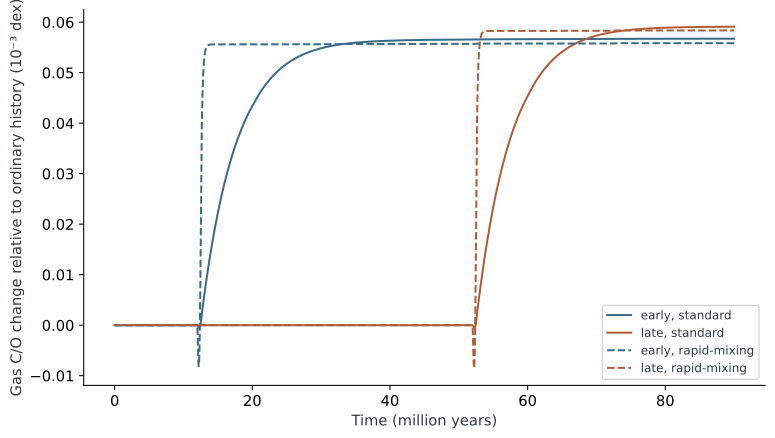
Delayed recycling of actual MESA winds into hot and cold gas, with four 15-solar-mass cohorts, inflow, outflow and explicit mass balance. A temporary rate shift ends during helium burning in the affected cohort. Early and late placement leave different gas histories even though the endpoint rates agree. This is a wind-only, fixed-metallicity response model; retained stellar material stays locked and no terminal yield, formation mechanism or catalogue fit is invented.Assumptions and provenance · Plotted data · PNG · SVG
V17-identifiability · Test the ordinary explanation
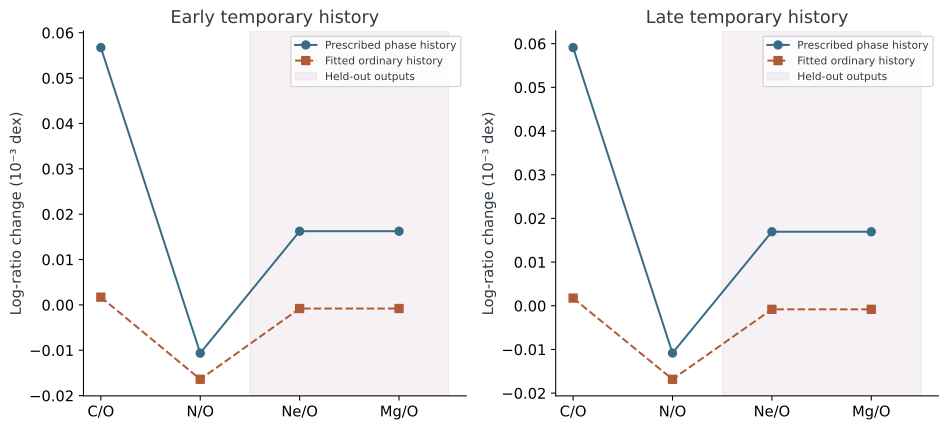
An ordinary enrichment model fits C/O and N/O by changing only declared mixing, star formation, dilution and outflow parameters. Ne/O and Mg/O are evaluated afterward as held-out outputs. These ratios share an oxygen denominator and are not four independent discoveries. Numerical differences and design-noise scenarios are reported; this is an internal model test, not a held-out astronomical detection.Assumptions and provenance · Plotted data · PNG · SVG
V19 · A different nuclear direction needs a persistent background
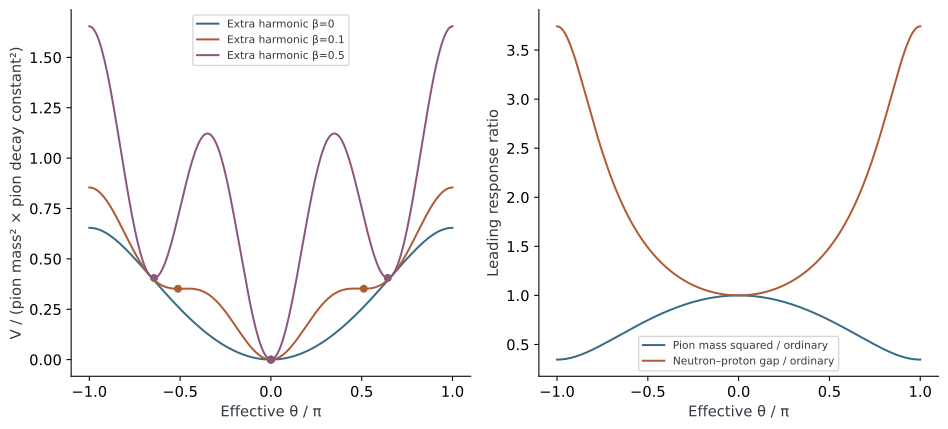
Leading chiral response is quadratic near θ=0. The ordinary QCD potential has no distinct stable nonzero-θ phase; adding a declared extra harmonic creates new extrema. These illustrative minima do not solve vacuum energy, formation or observational constraints. The two-nucleon baseline source audit failed, so no heavy-nuclear or stellar prediction follows from these curves. θ and −θ share CP-even masses but differ in CP-odd observables; 2π-related backgrounds are equivalent.Assumptions and provenance · Plotted data · PNG · SVG
V20 · Confinement must survive matter feedback
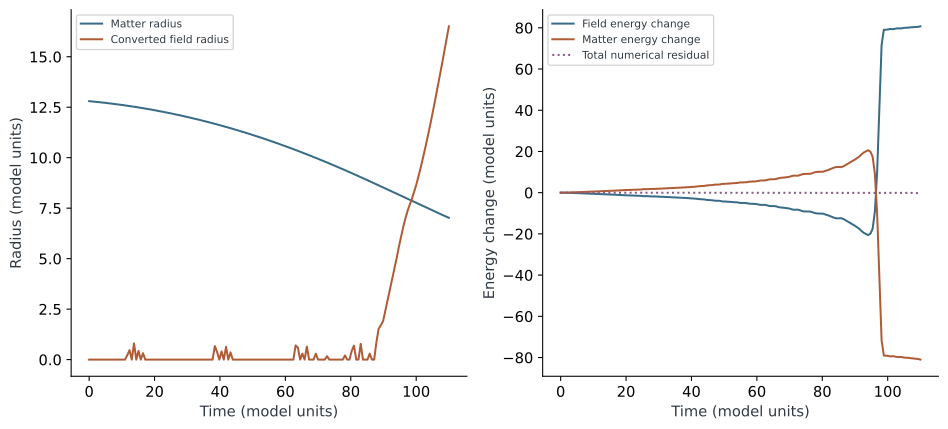
Conservative one-mode matter/field calculation with inertia 10⁶. The matter radius evolves in response to the field, and the boundary overtakes it within the tested interval. Mesh refinement checks exchanged energy itself, not only the much larger total energy. This is a homologous cloud reduction, not full local fluid dynamics or a neutron star. Longer underresolved runs and the low-inertia relativistic-speed failure remain in the records.Assumptions and provenance · Plotted data · PNG · SVG
V21 · Pressure supplies a radius, not a complete survival model
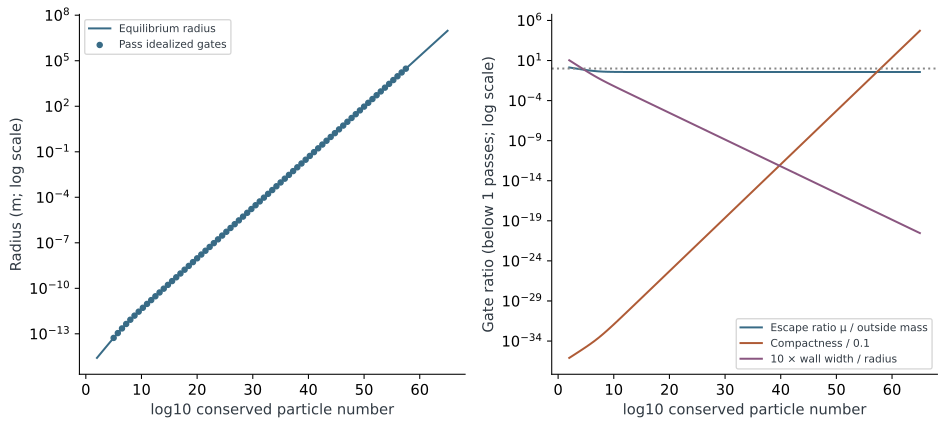
One declared slice of the conserved-fermion pocket model: λ=0.01, bias fraction 0.001 and Yukawa coupling 0.5. Radial balance, fission, zero-temperature escape and compactness gates are tested. Passing points still lack interacting/nonspherical stability, finite-temperature transport and a formation abundance. The ordinary-matter coupling is zero. The compactness cutoff marks failure of the approximation, not a calculated collapse boundary.Assumptions and provenance · Plotted data · PNG · SVG
V22 · Validate the continuum method before extending the nuclear claim
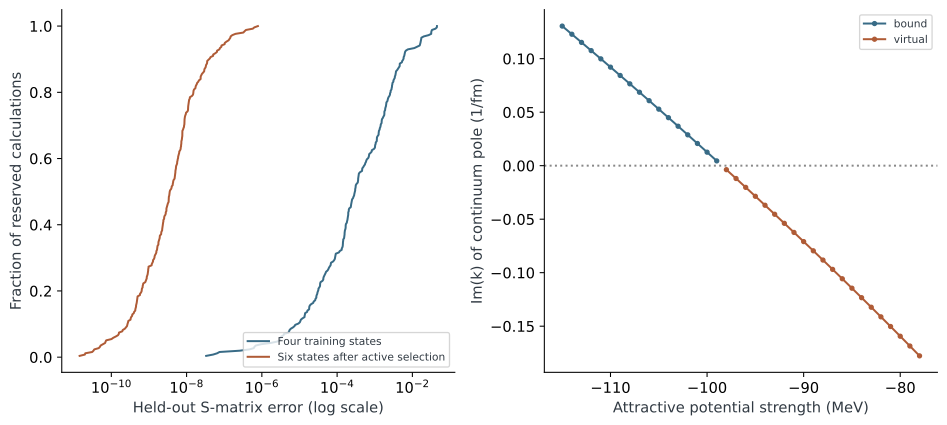
Minnesota NN singlet-S benchmark, with 256 reserved direct scattering calculations. Two actively selected basis states substantially reduce the error. Pole continuation distinguishes bound and virtual sheets through outgoing boundary conditions; these are not finite-box eigenvalues. The benchmark lacks a field-to-Hamiltonian map and does not compute alpha–alpha or Hoyle regimes. Basis disagreement is a heuristic uncertainty indicator.Assumptions and provenance · Plotted data · PNG · SVG
V23 · Core differences need not imply large wind-cooling differences
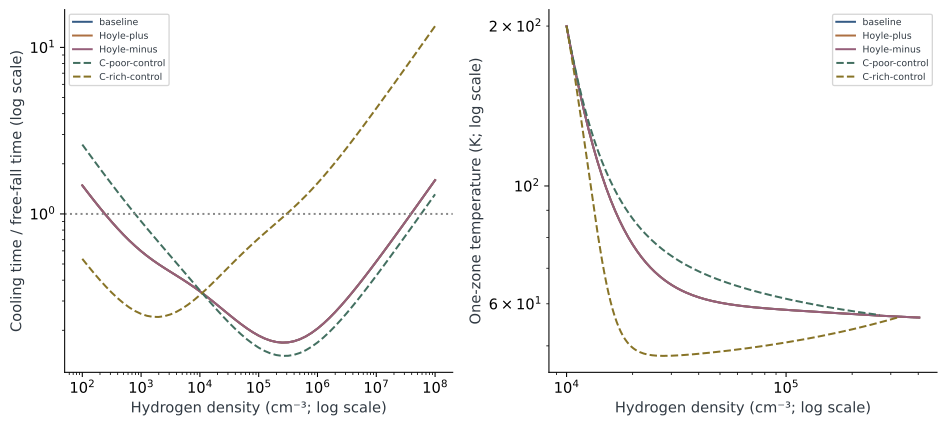
Same total metal fraction Z=10⁻⁵, with 70% of metals assigned to C+O. Actual wind patterns nearly overlap; deliberately carbon-poor/rich controls probe a much broader contrast. Left: fixed 200 K cooling diagnostic. Right: one-zone compression/cooling, stopped at the first validity limit when reached. These calculations omit molecular/dust cooling and resolved hydrodynamics, and predict neither fragmentation nor a stellar mass distribution.Assumptions and provenance · Plotted data · PNG · SVG
V24 · An isotope record measures an integral
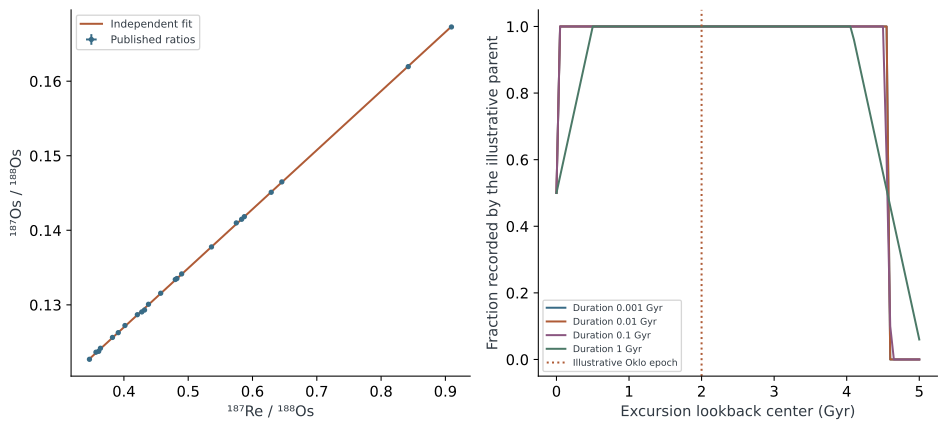
Left: actual published IAB-main-group isotope ratios with the independent errors-in-variables regression. Duplicate analyses and uncertain within-point correlation are handled in separate sensitivity/bootstrap calculations. The fitted slope measures integrated decay; a radiometric age is not imposed as an independent clock. Right: a declared 4.56-Gyr record and 2-Gyr Oklo window illustrate temporal coverage only. Those dates do not independently constrain the changing-decay fit.Assumptions and provenance · Plotted data · PNG · SVG
V25 · Finite inflation remembers its starting point
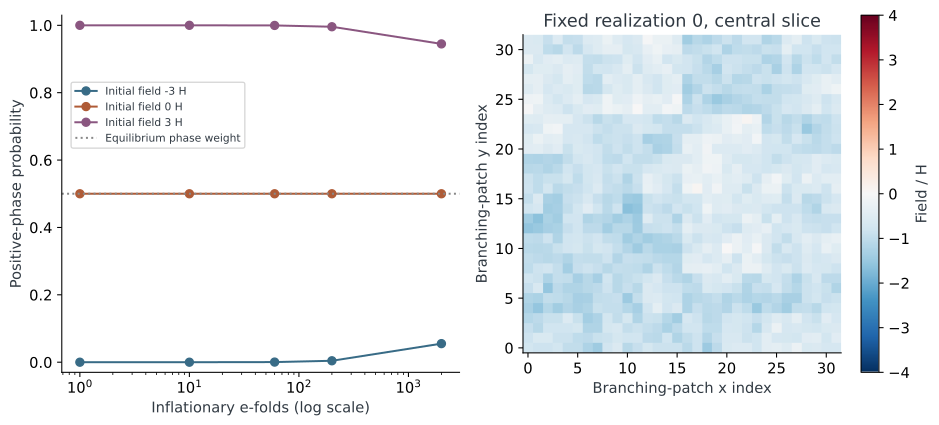
Canonical light spectator with λ=0.01, v/H=3 and fixed H. Finite-time solutions retain initial-condition memory even though equilibrium assigns equal phase weights. The spatial panel is a fixed-index slice of a correlated branching-patch approximation, whose octree geometry is not an isotropic cosmological lattice. No reheating-to-stars history or observer probability is inferred.Assumptions and provenance · Plotted data · PNG · SVG
V26 · A gravitational test needs a specified source
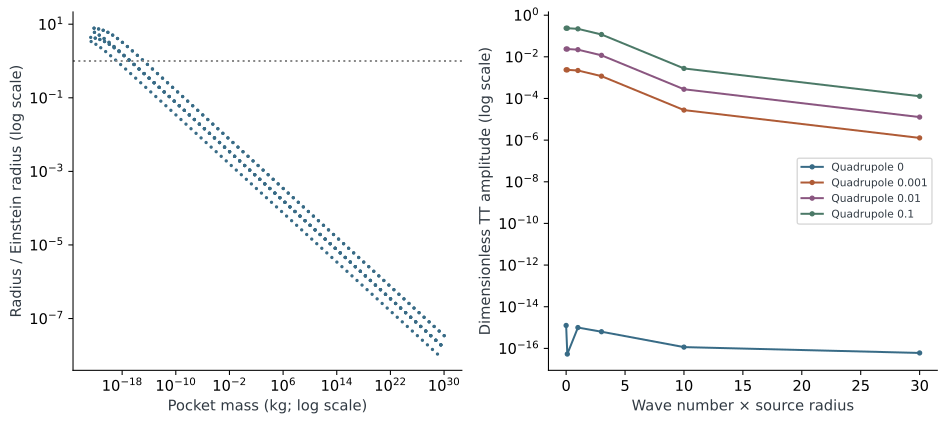
The same E17 pocket masses/radii give lens geometry for a declared 10-kpc lens and 50-kpc source. There is no abundance or survey-based detection forecast. Right: an exactly spherical stress source has zero tensor radiation up to numerical roundoff; imposed quadrupoles are method controls, not predicted transitions. A thermal sound-wave formula is not applied to these spherical events. Ordinary-matter coupling remains zero.Assumptions and provenance · Plotted data · PNG · SVG
V27 · Test the analogue against ensembles
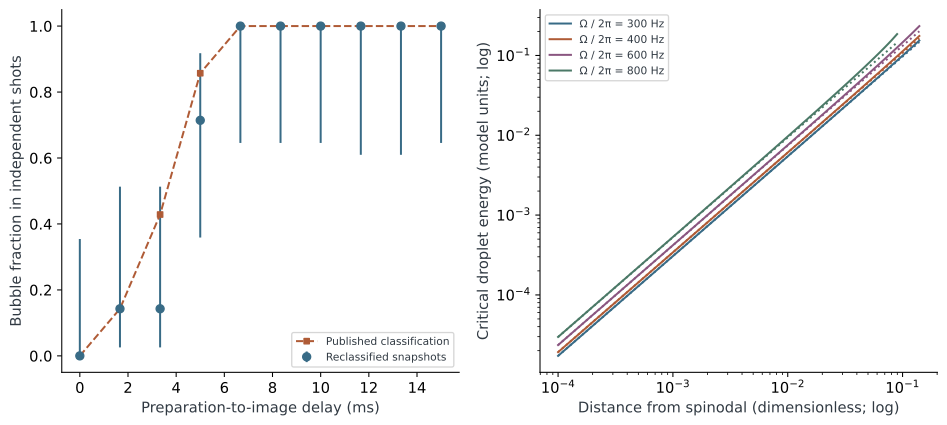
Actual released atomic snapshots are reclassified using a declared central window and threshold, with Wilson counting intervals. Different delays contain different destructive shots; they are not longitudinal bubble trajectories. Independent critical-droplet quadrature (solid) approaches the published spinodal approximation (dotted). This tests a thermal effective atomic field, not the Standard Model vacuum or a cosmological phase.Assumptions and provenance · Plotted data · PNG · SVG